Penetration Testing Metrics That Matter
 October 3, 2025

Running a penetration test is only half the battle. The real challenge is translating complex technical findings into insights that leadership can act on. The right metrics do not just highlight vulnerabilities; they tell a story about risk, resilience, and readiness. In this guide, we explore the penetration testing metrics that truly matter and how to present them in a way that resonates with decision-makers.
What Are Penetration Testing Metrics
Penetration Testing Metrics are quantifiable measures that track the outcomes of a pen test. They provide visibility into the number, severity, and type of vulnerabilities discovered, how quickly they are fixed, and what impact they have on the business. Metrics are typically descriptive, they answer what was found and what happened afterward.
Why Metrics Matter in Penetration Testing Reports
Leadership is less interested in technical details and more focused on quantifiable indicators that reflect risk, exposure, and progress.
Metrics provide clarity on:
- The volume and severity of vulnerabilities
- How many assets are impacted
- Trends in vulnerability discovery and remediation
- Efficiency and responsiveness of security teams
- Business risk implications linked to findings
Without these measurable insights, pen testingreports become data dumps rather than strategic tools.
Core Penetration Testing Metrics
1. Vulnerability Discovery & Risk Impact
These metrics show the scale and seriousness of weaknesses discovered during testing:
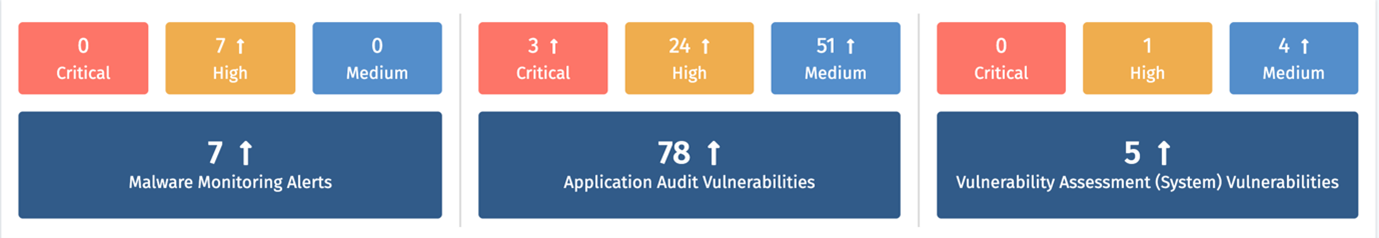
Vulnerability Count & Severity – A baseline measure of organizational health. Categorizing vulnerabilities as Critical, High, Medium, or Low provides leadership with an at-a-glance understanding of risk prioritization.
For example, Indusface WAS an AI-powered PTaaS platform typically uncovers a mix of vulnerabilities across these severity levels. Critical and high-severity vulnerabilities require immediate attention to reduce significant risk exposure, while medium and low-severity findings guide longer-term improvements in overall security posture.
In addition to identifying vulnerabilities, Indusface WAS also allows organizations to seamlessly onboard applications into WAAP and instantly patch open vulnerabilities using SwyftComply, an autonomous virtual patching solution.
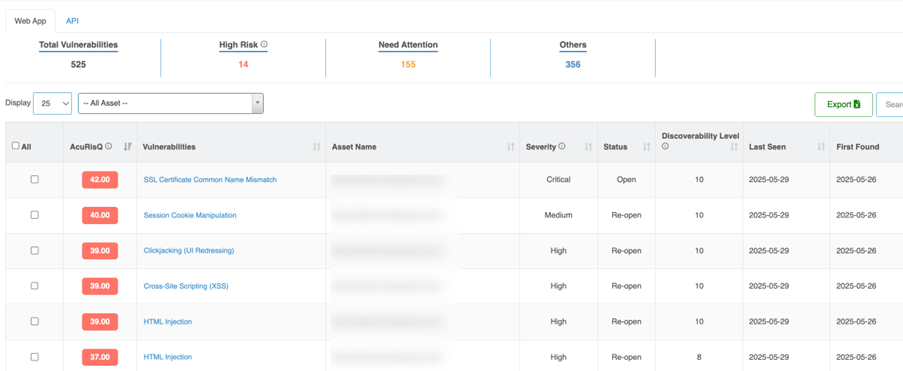
Exploitable Vulnerabilities – Not all vulnerabilities matter equally. Metrics should emphasize those that attackers could realistically exploit to cause harm. For instance, Indusface WAS comes with AcuRisQ a risk-based vulnerability scoring & prioritization feature, which quantifies the risk by considering factors such as discoverability, exploitability, business criticality, east-west dependence, and more. This helps security teams focus on the risks that directly impact business continuity and prioritize remediation effectively.
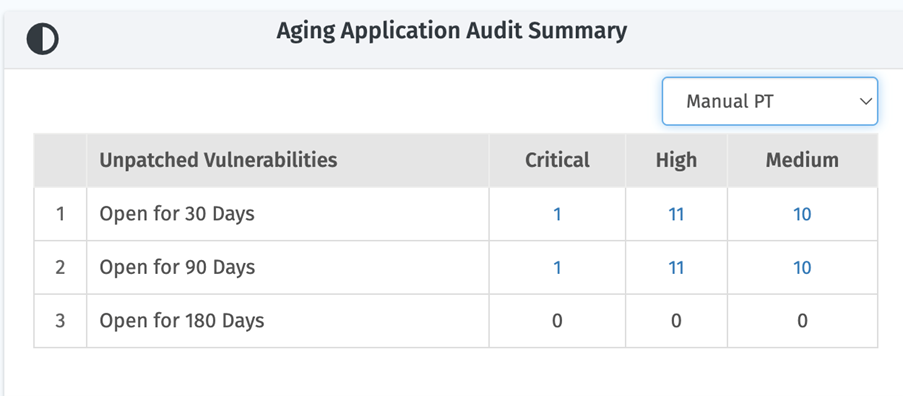
Open Vulnerabilities & Aging – Tracking the number of unresolved vulnerabilities over time reveals backlog risks. Aging data on open critical vulnerabilities highlights where remediation processes may be faltering.
Reoccurrence Rate – Recurring vulnerabilities across multiple penetration tests reveal process deficiencies or incomplete fixes. Leadership requires visibility into recurring vulnerabilities to facilitate long-term resolution.
2. Remediation Efficiency
Leadership cares about how quickly and effectively vulnerabilities are resolved:
- Mean Time to Remediate (MTTR) – A key measure of responsiveness. A downward trend in MTTR reflects improved workflows and collaboration between security and development teams.
- Critical Finding Closure Rate – The percentage of critical and high-severity vulnerabilities closed within agreed service-level agreements (SLAs). This metric reassures leadership that the riskiest problems are being prioritized.
- Patch Latency (Days to Patch) – Indicates the speed at which teams apply patches after vendors release them. Reducing patch latency minimizes exposure windows.
3. Detection & Response Effectiveness
Penetration testing often includes simulations of real-world breaches, making these metrics critical for leadership oversight:
- Mean Time to Detect (MTTD) – Indicates how quickly suspicious activity or intrusions are spotted. Shorter times reflect stronger monitoring and alerting systems.
- Mean Time to Acknowledge (MTTA) – Shows how long it takes for the security team to formally log or escalate a vulnerability after it is detected. This demonstrates operational readiness.
- Mean Time to Contain (MTTC) – Tracks how quickly the team can limit the spread or impact of a breach. Effective containment reduces overall damage.
- Mean Time to Resolve (MTTR) – Captures the full lifecycle of detection, containment, and recovery. This holistic metric is vital for leadership because it quantifies resilience.
4. Business Impact Metrics
Executives think in terms of cost, productivity, and brand reputation. These metrics bridge the gap:
- Cost per Incident – Quantifies the financial impact of vulnerabilities, including downtime, staff overtime, customer support, and lost revenue.
- Financial Risk Reduction – Shows leadership how remediation directly lowers potential losses. Using models like FAIR (Factor Analysis of Information Risk), vulnerabilities can be translated into projected loss avoidance figures.
- Security Ratings – At-a-glance scores (A–F) across risk categories like endpoint security, patching cadence, and leaked credentials. These simple ratings help leadership benchmark security posture against competitors.
5. Process & Quality Indicators
These metrics reflect the maturity of the security program and credibility of testing:
- False Positive Rate –High false positives waste resources and undermine confidence. Indusface WAS ensures zero false positivesby combining AI-driven detection with human verification. Each vulnerability is supported with evidence, including tampered requests and responses, automatically generated by the PoC tool and verified by the Managed Security Team. Organizations can get evidence to see why a vulnerability is marked valid, giving leadership confidence in the reliability of testing outputs.
- Code Coverage – Shows how much of the system or application environment has been tested. More coverage reduces blind spots and gives executives confidence in test comprehensiveness.
- Privileged Access Reviews – Tracks how often high-level accounts are audited. Since pentests frequently uncover privilege escalation risks, this metric signals proactive control.
What a Penetration Testing Metrics Dashboard Should Include
A consolidated dashboard provides real-time insight for leadership, featuring:
| Metric | Description |
|---|---|
| Findings by Severity | Categorize vulnerabilities by Critical, High, Medium, Low to focus remediation where it matters most. |
| Exploitable vs. Non-Exploitable Vulnerabilities | Highlight the vulnerabilities that pose actual risk to the business. |
| Mean Time to Detect (MTTD) & Mean Time to Remediate (MTTR) Trends | Show how quickly threats are identified and resolved over time. |
| Reoccurring Vulnerabilities | Identify systemic weaknesses that continue to resurface across test cycles. |
| Patch Latency by Asset | Track how long it takes to patch critical assets after vendor releases. |
Ready to see how comprehensive, expert-led penetration testing can strengthen your security posture and reduce risk?
Take the first step toward proactive security.
Start a free trial with Indusface WAS now and secure your business for the future.
Stay tuned for more relevant and interesting security articles. Follow Indusface on Facebook, Twitter, and LinkedIn.